 |
        |
| |
| |
An average trade pattern during one day has several small peaks and several periods with little activity. During a peak, the activity can be so intense that delay in technology used can hinder your active participation. Within seconds a bid is placed on the market place, someone hits the bid and then it is gone. Speed is king in these situations. Any delay in technology used will put you in 3. division as a buyer. Please note that the number of transactions carried out by use of telephone not nessesarily are reduced even if the persentage share is reduced.
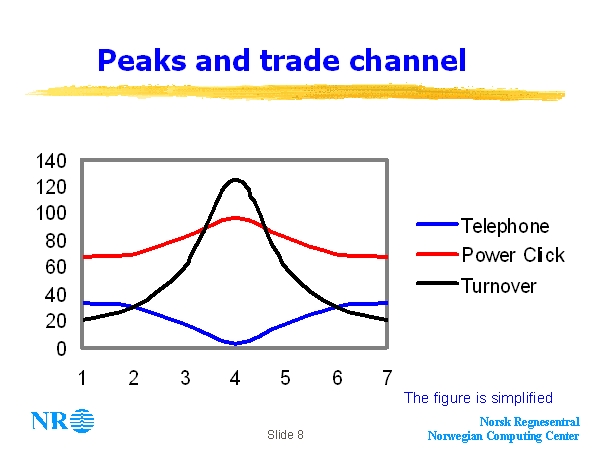
When combining statistics from traded volume and electronic commerce it shows that when turnover volume is rising the percentage of trade transactions done by electronic commerce also rises. I believe that difference in speed to the market place between telephone based trade and electronic commerce trade is the main reason for this. Limitation in number of people at the helpdesk makes use of telephone a bottleneck in peak periods.
The average share traded by use of electronic commerce is 67%, at the
all time high peak it was 97%. The all time high peak the 28 th of
april was 5 times as high as the previous record.
Concluding remark is that when turnover increase, percentage share
of electronic commerce trasactions traded rises and the percentage share
of telephone is reduced.